Production Dashboard
OEE, Throughput, FPY
OEE (availability × performance × quality), throughput, first-pass yield, scrap rate, on-time delivery, and overdue work orders. Drillable to work orders, operations, stations.
OEE, Throughput, FPY, WIP, On-Time Delivery — All Drillable
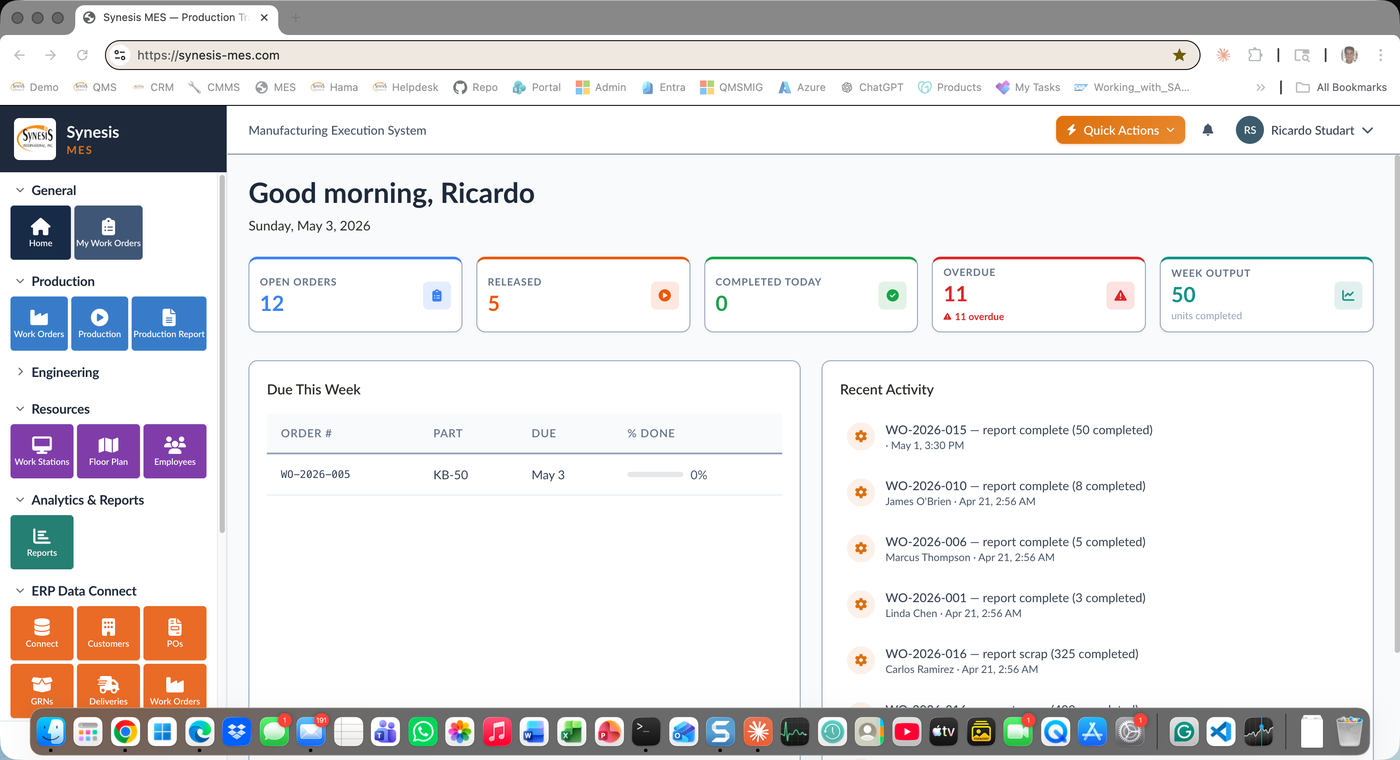
Synesis MES Reports, KPI and Dashboards turn shop-floor data into management decisions. OEE (Overall Equipment Effectiveness), throughput, work-in-process, scrap rate, first-pass yield, on-time delivery, earned-hours productivity, and machine utilization are computed live from production postings, labor records, work orders, and quality results. Every chart and KPI drills down to the underlying transactions — click a slice, see the records.
Process dashboards are tuned per workflow. The Production Dashboard tracks OEE, throughput, FPY, and on-time delivery. The Plant Floor Dashboard ties to the live workstation map. The Labor Dashboard tracks earned hours and shift productivity. Direct Power BI integration for organizations standardizing on Microsoft analytics. Excel exports for everything.
OEE, Throughput, FPY
OEE (availability × performance × quality), throughput, first-pass yield, scrap rate, on-time delivery, and overdue work orders. Drillable to work orders, operations, stations.
Workstation Status & Output
Live workstation status (running/setup/blocked/down/starved/idle) tied to the visual plant floor map. Output today, week, month with trend lines.
Earned Hours & Productivity
Earned hours vs. clock hours by operator, work center, shift, and department. Productivity trend by week. Direct vs. indirect labor mix.
FPY & Scrap Analysis
First-pass yield by work center and operation. Scrap rate by reason code. Top failure modes. Direct link to Synesis QMS nonconformances.
Backlog & Throughput
Work order backlog by status, priority, customer, and due date. On-time start, on-time completion, cycle time vs. standard.
Cross-System Visibility
Equipment downtime from Synesis CMMS reflected in MES capacity planning. Failed quality checks from Synesis QMS visible at the operation level.
Standard Office Outputs
Every list, dashboard, and report exports to Excel with one click. Detail records export to Word with branded letterhead. Print-friendly views for production meetings.
Enterprise BI
Direct Power BI connection. Pre-built MES datasets and visuals. Embed in Teams, SharePoint, or the MES itself for plant managers and executives.
OEE computed from real-time production postings and downtime, not from yesterday's spreadsheet. Hour-by-hour visibility into the gap.
Start with plant-level OEE. Drill to work center. Drill to station. Drill to operation. Drill to operator. Drill to the failed inspection.
Promise dates from ERP. Actual completion from MES production posting. Variance surfaces by customer and product family.
When OEE drops, you see why instantly: a quality reject in QMS, an equipment failure in CMMS, or an operator-cycle issue in MES.
Show us the metrics your plant leadership wants to see — we'll build a dashboard that drills into the data.
Request a Demo