Live Workstation Status
Color-Coded Real Time
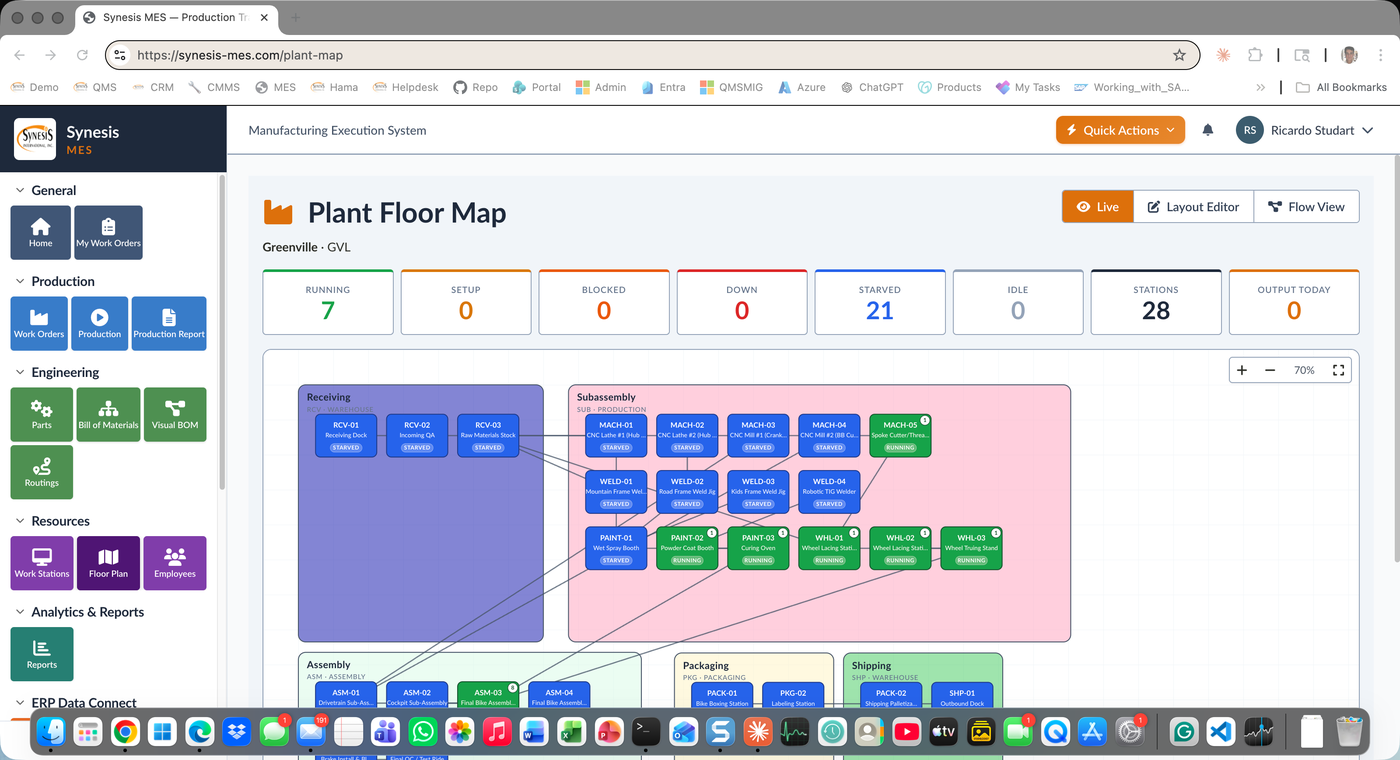
Each station's color reflects its current state: running (green), setup (blue), blocked (red), down (red striped), starved (orange), idle (gray). Updates in real time as production happens.
Visual Plant Floor Map with Live Status and Drillable Workstation Visibility
Synesis MES Plant Floor gives plant managers and supervisors a live visual map of every workstation in the plant. Each station's color reflects its current state — running, setup, blocked, down, starved, idle. KPI strip at the top shows aggregate counts. Click any station to see the active work order, the operator, the cycle time, and the next work order in queue. Switch to Flow View to see how parts move through the layout for a specific work order.
The plant floor map is a Layout Editor canvas. Drag, resize, and label workstations to match your actual factory floor. Areas group stations into meaningful zones — Receiving, Subassembly, Assembly, Packaging, Shipping. The map updates in real time as work orders progress, so you see the plant breathe.
Color-Coded Real Time
Each station's color reflects its current state: running (green), setup (blue), blocked (red), down (red striped), starved (orange), idle (gray). Updates in real time as production happens.
Aggregate Plant View
Top-of-screen KPI strip shows running count, setup count, blocked count, down count, starved count, idle count, total stations, and output today.
Drag & Drop Plant Map
Visually arrange stations to match your actual factory floor. Drag, resize, label. Group into areas. Layout changes preserve historical data.
Two Visualization Modes
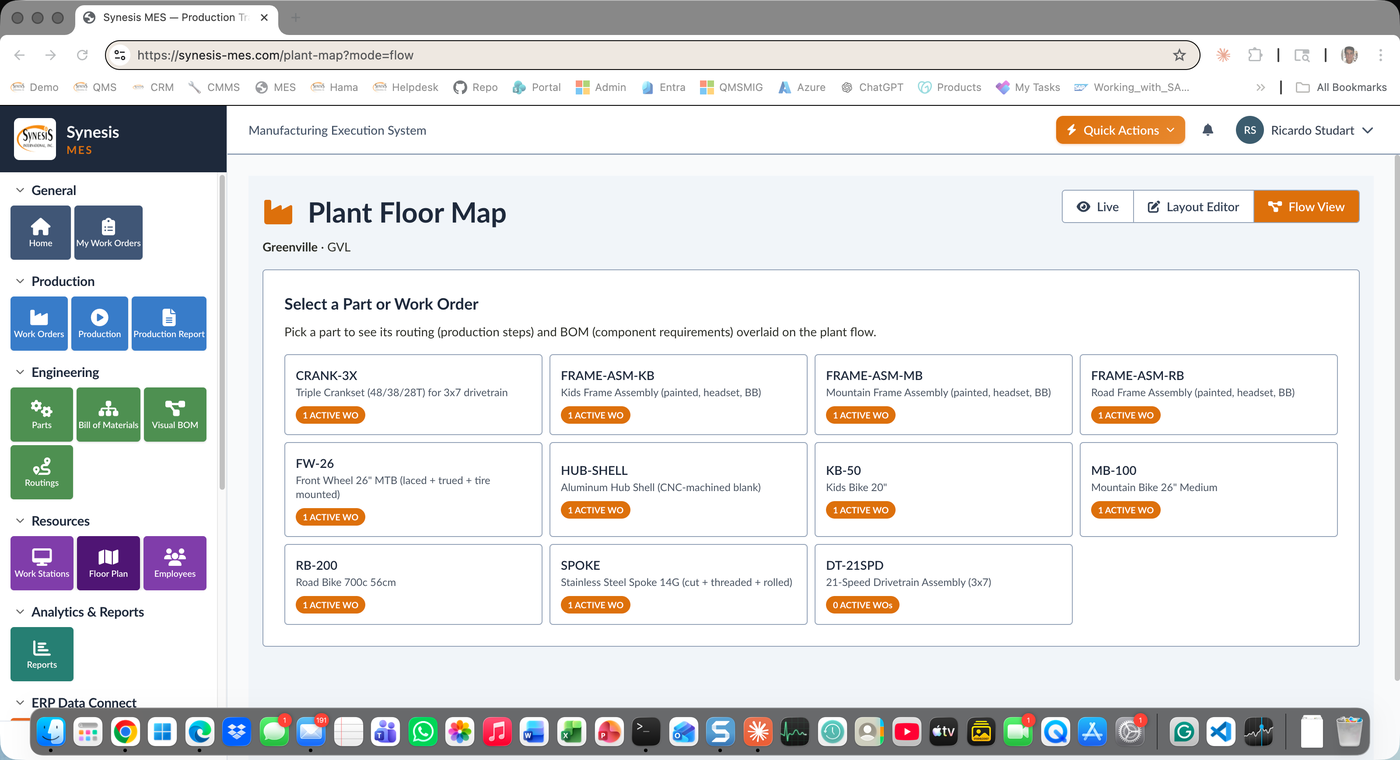
Live View shows current station status. Flow View shows how parts move through the layout for a specific work order — visualizing routing as a flow over the plant.
Drill to Operations
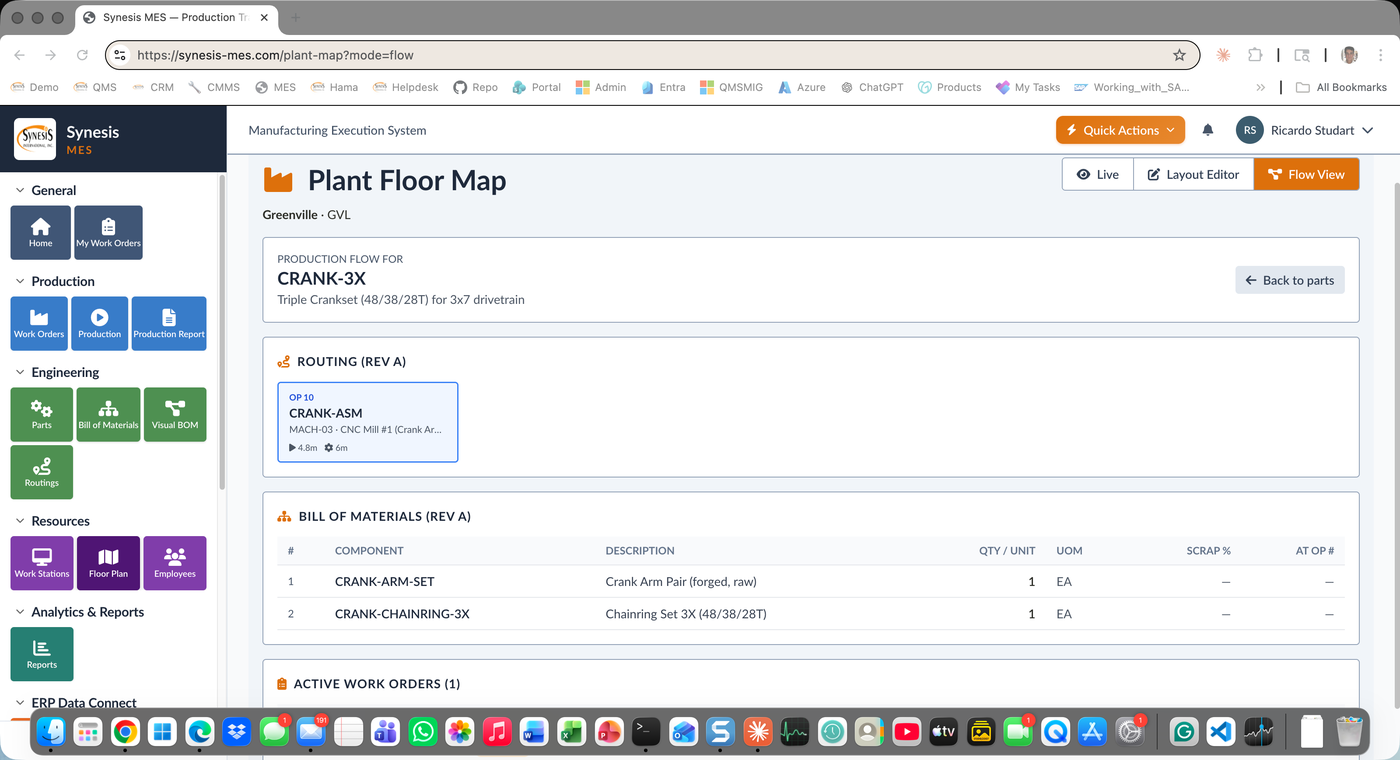
Click any station to see the active work order, operator, cycle time, and next work order in queue. Drill into the operation, the routing, and the BOM.
Receiving to Shipping
Group stations into meaningful production areas: Receiving, Subassembly, Assembly, Packaging, Shipping. Roll up KPIs by area.
Per-Part-Number View
Select a part number to overlay its routing flow on the plant map. Bottlenecks, transfer distances, and inefficiencies become visually obvious.
Tablets & Phones
The plant floor map renders on tablets, large displays, and phones. Plant managers see the floor from their office or from a wall monitor.
Supervisors see a station go red the moment it goes down — they're walking to it before the operator finishes calling for help.
Flow View visualizes routing inefficiencies on the actual plant layout. Identify transfer waste, bottlenecks, and rebalance opportunities.
Total running stations, total down, output today — at a glance, on every screen, all the time.
Click any station to see what's happening right now — work order, operator, cycle time, next in queue.
See Synesis MES Plant Floor configured for your factory layout, your work centers, and your real-world production flow.
Request a Demo