Quality Events Dashboard
Combined Module View
Open vs Closed counts by module, CAPA by status, NCR by severity, RMA by stage, Change Control by approval status. Drill from any chart to the underlying records.
Drillable Reports, Role-Aware KPIs, Process Dashboards, and Management Review
Quality data only matters if you can act on it. Synesis QMS analytics give every leader, manager, and operator the right view of quality performance — from a 30,000-foot Quality Events Dashboard down to a single nonconformance, complaint, or audit finding. Every chart, KPI, and metric is drillable: click a slice of a pie chart and you see the records behind it. Filter, sort, and export to Excel without ever leaving the page.
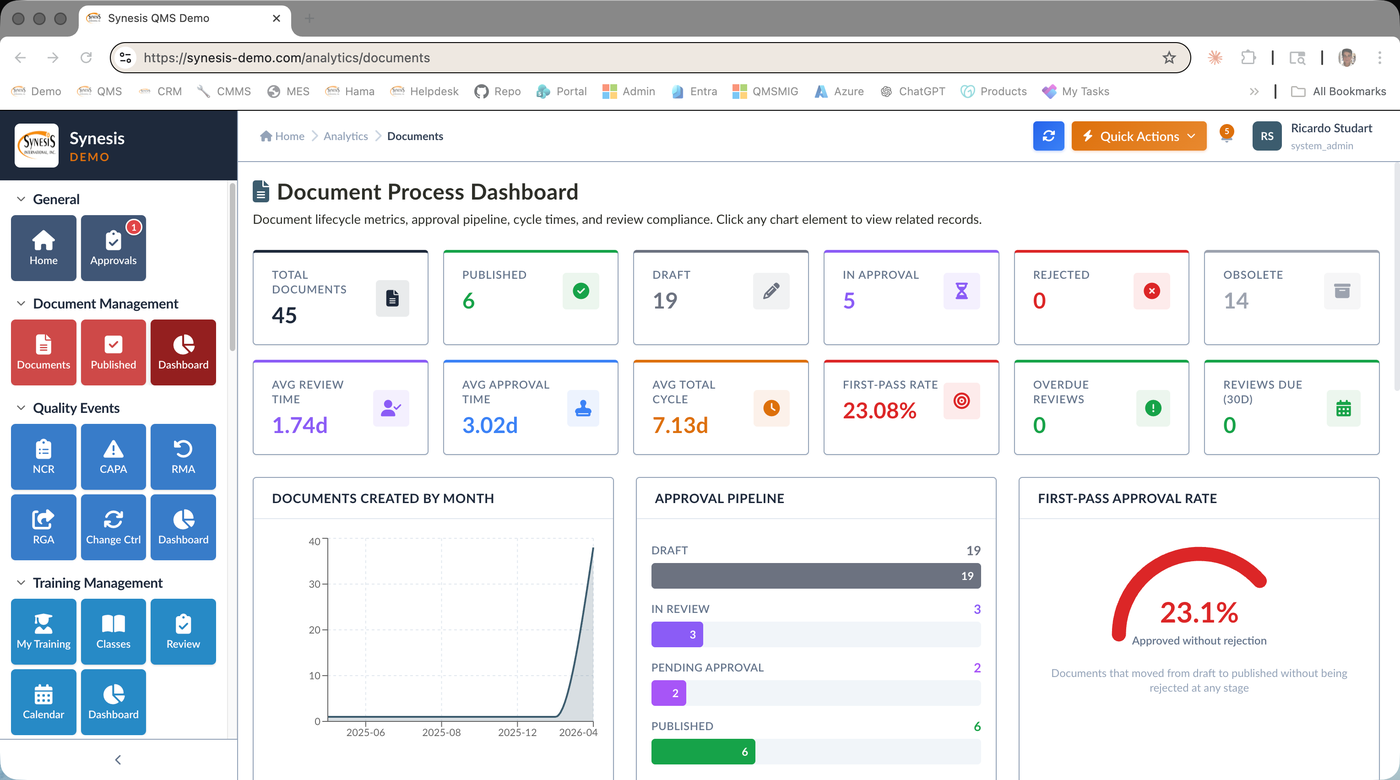
Process dashboards are tuned per workflow. The Document Process Dashboard tracks lifecycle KPIs — average review time, average approval time, total cycle time, first-pass approval rate, overdue reviews, reviews-due-soon. The Quality Events Dashboard combines CAPA, NCR, RMA, and Change Control metrics in one place. The Suppliers & Risk Dashboard surfaces risk concentration. ISO 9001 §9.3 Management Review pulls inputs from all 9 required clause sources automatically.
Combined Module View
Open vs Closed counts by module, CAPA by status, NCR by severity, RMA by stage, Change Control by approval status. Drill from any chart to the underlying records.
Lifecycle Analytics
Total documents, in approval, draft, effective, obsolete. Average review and approval time, total cycle, first-pass approval rate. Documents created by month, approval pipeline funnel, overdue reviews.
Performance & Risk
Supplier scorecards, SCAR closure times, on-time delivery, quality cost. Risk register heatmap, RPN distribution, top risks by category and owner.
Production Quality
Inspection pass rates, calibration due/overdue, audit findings by department, training completion, equipment downtime. Filter by site, line, or department.
Cross-System View
Customer returns, vendor performance, batch traceability, work order quality. Pulls live from your SAP or other ERP via the ERP Connect integration.
Required Inputs Built-In
Pre-built management review template that pulls inputs from CAPA, NCR, audits, RMA, complaints, risk, suppliers, OFI, and prior actions automatically. Track decisions and follow-up actions.
Standard Office Outputs
Every list, dashboard, and report exports to Excel with one click. Detail records export to Word with branded letterhead. Print-friendly views for meetings and audits.
Enterprise BI
Direct Power BI connection for organizations standardizing on Microsoft analytics. Pre-built quality datasets and visuals. Embed in Teams, SharePoint, or the QMS itself.
Every KPI, chart segment, and stat number is a link. Click to see the records that make up the number. No more standalone reports that don't tie back.
Dashboards refresh on demand or on schedule. No nightly ETL. No data lag. The number you see is the number that's live in the system.
Quality Engineers see open items by site. Managers see trends and exceptions. Executives see strategic KPIs and compliance posture. Same data, right view.
Management review, internal audit, and external audit reports all pull from live data with full traceability. Auditors get what they need without weeks of preparation.
Quality KPI dashboards and reports turn the data captured across the QMS into real-time visibility on the metrics that matter, such as open CAPAs, overdue training, on-time audit completion, supplier scorecards, nonconformance trends, and inspection pass rates. Synesis QMS quality KPI dashboards and reports pull from every module automatically, so manufacturers see a single source of truth instead of stitching numbers together from spreadsheets at month end.
ISO 9001 Clause 9.3 requires top management to review quality performance using defined inputs such as audit results, customer feedback, nonconformities, and CAPA status. Quality KPI dashboards and reports deliver these inputs ready-made, with trends and exportable summaries that feed the management review directly. For manufacturers this turns a slow, manual data-gathering exercise into a live, audit-ready view of the quality system.
Yes. The quality KPI dashboards and reports are interactive, so clicking a KPI card or chart segment navigates straight to the filtered list of underlying records, whether that is overdue CAPAs, failed inspections, or at-risk suppliers. This lets quality managers move from a high-level number to the specific corrective action or audit finding in seconds, keeping decisions grounded in real data.
Yes. As an SAP Gold Partner, Synesis offers native SAP Business One integration, so quality KPI dashboards and reports can reflect production, receiving, and supplier data alongside CAPA, audit, and nonconformance metrics. Because every module on the Synesis QMS platform feeds the same reporting layer, manufacturers get closed-loop visibility, and the dashboards work whether the system is deployed in the cloud or on-premise.
Show us the metrics your leadership wants to see — we'll build a dashboard that drills into the data.
Request a QMS Demo